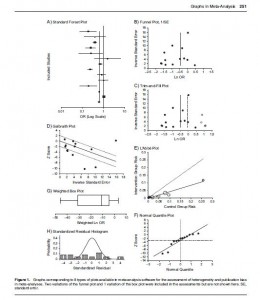
2008年の論文ですが、メタアナリシスにおけるグラフの効力
Graphical displays for meta-analysis: An overview with suggestions for practice
American Journal of Epidemiology 169:249-255
貴方がメタアナリシスを実施できるならば、これらのグラフのうち、どの程度を提示できるだろうか・・・・・・・
A) Standard Forest Plot
B) Funnel Plot
C) Trim-and-Fill Plot
D) Galbraith Plot
E) L’Abbe Plot
F) Normal Quantile Plot
G) Weighted Box Plot
H) Standardized Residual Histogram
2015年のいまは、さらに様々なグラフがあります。グラフはアートという視点からすると、
個人的には、contour-enhanced funnel plot with Trim and Fill(STATA)や、Galbraith plot(metafor/R)がいいね。


