Category: ‘システマティックレビュー’

GRADE CPG作成の基本ー3.3:[SR]エビデンスの収集-③ PRISMA

2016年8月9日 Posted by aihara

[GRADE-CPG解説資料-⑨]

システマティックレビューにおける文献検索や適格基準(組み入れ基準と除外基準)に見合った文献採用の情報を把握するために、PRISMAチェックリストや、フローチャートの活用が有効です。PRISMAチェックリストは、システマティックレビューの質向上にもつながるものです。
(PRISMAチェックリストについては、GRADE2版6.3章を参照ください。PRISMA翻訳改訂版については、オンライン追加資料を参照ください。)

PRISMAフローチャートは、RevManを使って、”Study flow diagram”として簡単に作成することができます。
RevMan5を使って作成したフロー図が以下です:
http://www.grade-jpn.com/online_supplementals/Flow_diagram_(triple-X).svg

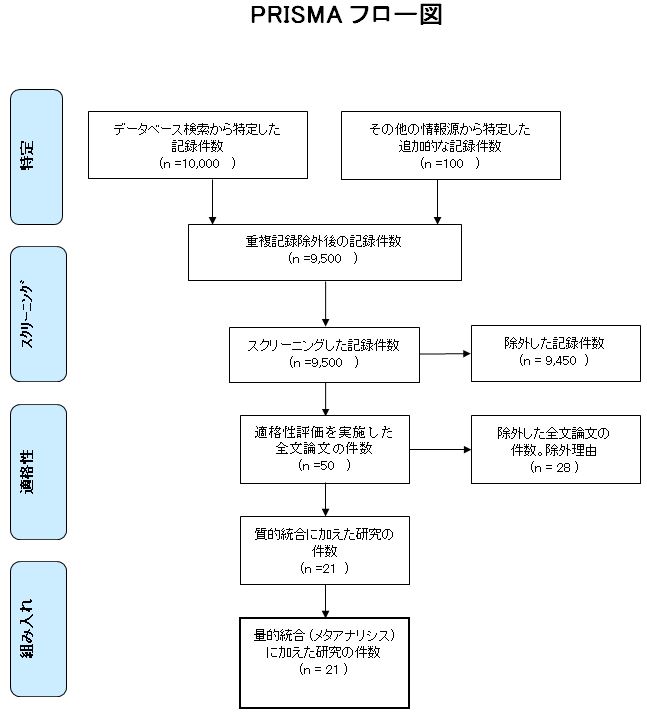
仮想のCQ(トリプルX)に関するシステマティックレビューでは、以下のStudy flow diagramが作成されました(図1)。

つまり、特定した研究が10,100件あり、スクリーニングした9,500件から9,450件を除外した50件について適格性の評価を実施しています。50件から28件を除外し、質的統合に加えた研究が21件で、量的統合(メタアナリシス)に加えた研究が21件です。

図1

prisma_flow

除外された研究の一つ(Korea_2002)のフォレストプロットが以下です。

Forest_plot_excluded


PRISMAチェックリストの翻訳版はGFRADE2版の6.3章に記載していますが、
Prisma-statement.org/Translationsで本資料が公開されることになり、マイナーな変更をしました。
GRADE2版のオンライン資料にも同じ改変版をアップしています。


PRISMAチェックリスト日本語版の改変

2016年7月14日 Posted by aihara

PRISMA checklistflow diagramの翻訳版は、書籍「診療ガイドラインのためのGRADEシステム」の初版から紹介し、第2版でも追加資料3に記載してあります。

このたび、PRISMAのwebサイト(http://www.prisma-statement.org/Translations/Translations.aspx)に、この日本語翻訳版を掲載していただくことが決定しました。

PRISMAメンバーとのやり取りの結果、掲載にあたって、いくつかの対訳を変更しましたので、以下にその最終版をアップしました。今後は、PRISMAの日本語資料としてこれらを利用してください。

GRADE2版の関連 online_supplemental_materials

●PRISMA_2009_flow_diagram_R_20160713.docx
●PRISMA_2009_checklist_R_20160713.docx
●PRISMA_2009_checklist_evaluation_example-R.docx


欠損値(missing data)に関するimputation strategy

2016年4月27日 Posted by aihara

SRにおいて、”欠損値(missing data)”は、Risk of biasのうちの”不完全なアウトカム報告”につながります。
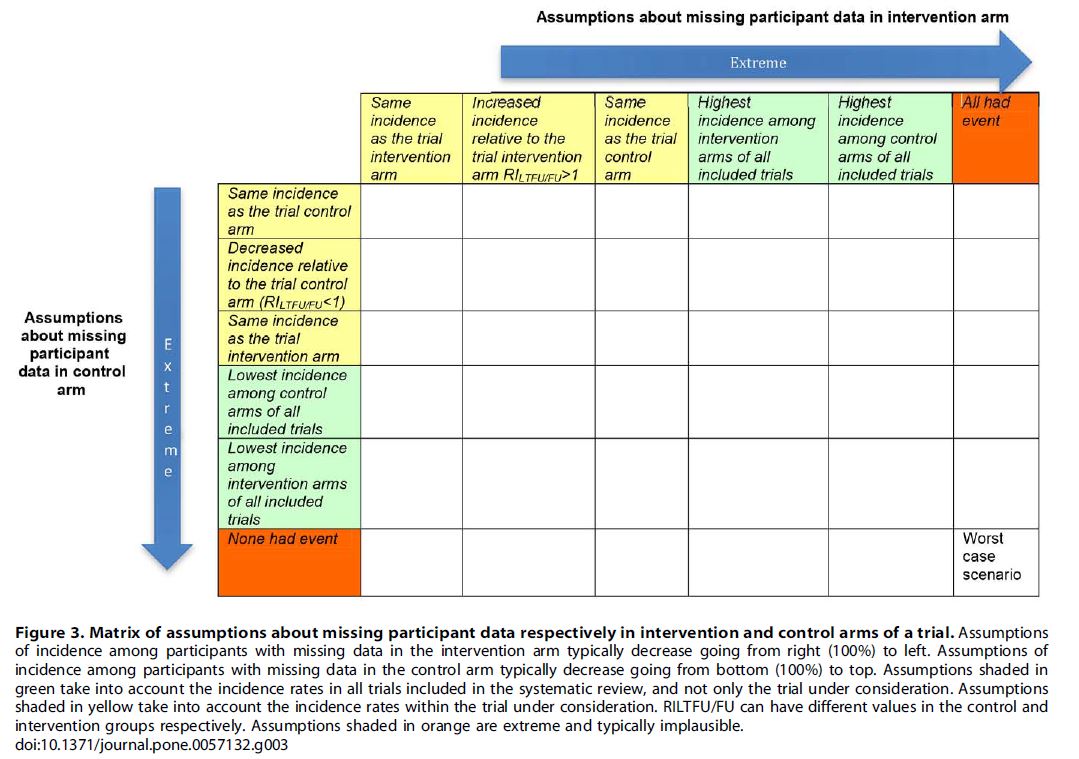
“missing data”のある試験をどのように対処すべきかという問題に対して、‘‘worst-case scenario,’’を始めとしたさまざまな補完戦略(imputation strategy)があります。GRADEmemberによる関連論文が発表されており、2値アウトカムのケースの解析法が以下の図です。


●2値アウトカム:
Addressing Dichotomous Data for Participants Excluded from Trial Analysis: A Guide for Systematic Reviewers
http://www.ncbi.nlm.nih.gov/pubmed/23451162


●連続アウトカム:
・同じ尺度の場合:
Addressing continuous data for participants excluded from trial analysis:a guide for systematic reviewers
http://www.ncbi.nlm.nih.gov/pubmed/23774111

・異なる尺度の場合:
Addressing continuous data measured with different instruments for participants excluded from trial analysis:a guide for systematic reviewers
http://www.ncbi.nlm.nih.gov/pubmed/24613497


でもって、さらにGRADE working groupは、missing dataに伴うrisk of biasのグレードダウン評価を補完戦略で考え、さらに診療ガイドラインのエビデンスの質評価にも利用いようと主張しています。

■研究における参加の流れ
figure

■解析方法
table1

■missing matrix
missing_matrix


SRの著者は絶対効果と相対効果の双方を報告すべき

2015年11月17日 Posted by aihara

Alonso-Coello P, et al.
Systematic reviews suffer from major limitations in reporting absolute effects.
J Clin Epidemiol. 2015 Nov 8. pii: S0895-4356(15)00505-3. doi: 10.1016/j.jclinepi.2015.11.002.

Abstract

BACKGROUND:
Expressing treatment effects in relative terms yields larger numbers than expressions in absolute terms, affecting the judgement of the clinicians and patients regarding the treatment options. It is uncertain how authors of systematic reviews (SRs) absolute effect estimates are reported in). We therefore undertook a systematic survey to identify and describe the reporting and methods for calculating absolute effect estimates in SRs.

METHODS:
Two reviewers independently screened title, abstract and full text, and extracted data from a sample of Cochrane and non-Cochrane SRs. We used regression analyses to examine the association between study characteristics and the reporting of absolute estimates for the most patient-important outcome.

RESULTS:
We included 202 SR (98 Cochrane and 104 non-Cochrane), the majority of which (92.1%) included standard meta-analyses including relative estimates of effect. Of the 202 SRs, 73 (36.1%) reported absolute effect estimates for the most patient-important outcome. SRs with statistically significant effects were more likely to report absolute estimates (odds ratio: 2.26, 95%-CI: 1.08 to 4.74). The most commonly reported absolute estimates were: for each intervention, risk of adverse outcomes expressed as a percentage (41.1%); number needed to treat (26.0%); and risk for each intervention expressed as natural units or natural frequencies (24.7%). In 12.3% of the SRs that reported absolute effect estimates for both benefit and harm outcomes, harm outcomes were reported exclusively as absolute estimates. Exclusively reporting of beneficial outcomes as absolute estimates occurred in 6.8% of the SRs.

CONCLUSIONS:
Most SRs do not report absolute effects. Those that do often report them inadequately, thus requiring users of SRs to generate their own estimates of absolute effects. For any apparently effective or harmful intervention, SR authors should report both absolute and relative estimates to optimise the interpretation of their findings.

注:コクランハンドブックにおいては、SR著者に、絶対効果が常に表示されるSoF table(以下)をレビューに含めるように勧めています。
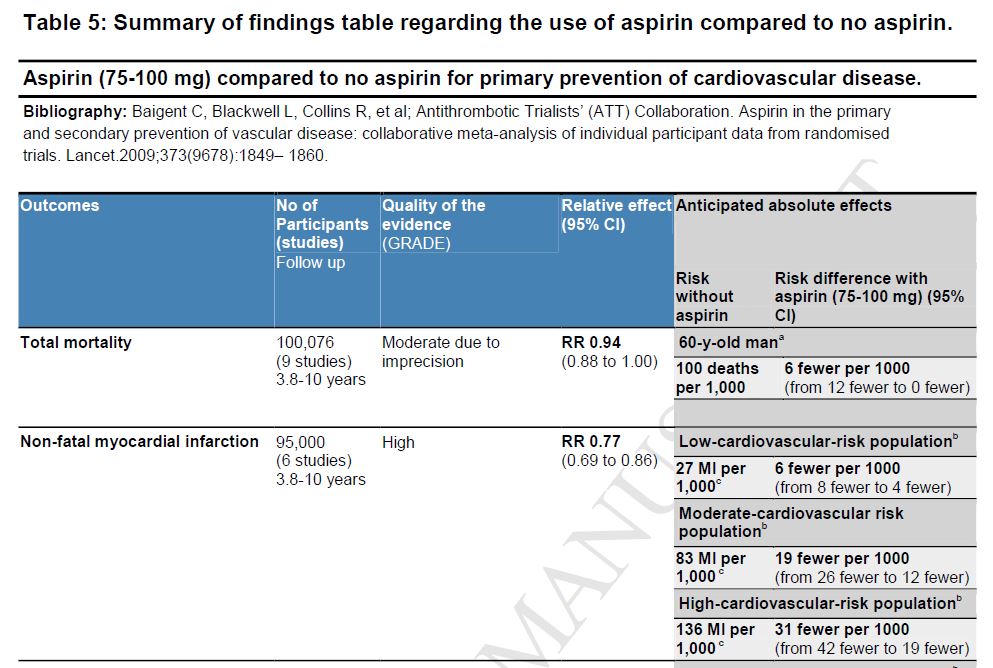
sof

システマティックレビューにおけるbody of evidenceの質:EPC update 2015

2015年11月10日 Posted by aihara

AHRQ/EPCの、システマティックレビューにおけるbody of evidenceの質(Strength of evidence)の評価法は、GRADEを改変したものです。

Grading the strength of a body of evidence when assessing health care interventions: an EPC update
Berkman ND, et al. J Clin Epidemiol. 2015 Nov;68(11):1312-24. doi: 10.1016/j.jclinepi.2014.11.023.

●エビデンスの強さ(SOE)

soe

●GRADEとの違い

AHRQ/EPCの改変GRADEによる評価については、(GRADEと違って)以下の注意が必要です。

●エビデンスの強さは、high、moderate、low、insufficientの4段階。

●”low”と”insufficient”の違い:”Low”はレビュアは結論を引き出すことができるが、”insufficient”はレビュアはいかなる結論も引き出すことができない。

●エビデンスンの強さは、個々のアウトカムに関してのみ評価し、アウトカム全般にわたる全体的なエビデンスの質は評価しない(なぜならば、診療ガイドラインの推奨作成を目的とした、介入の利益と害のバランスを判定することはなく、各アウトカムに関するSOEを提示することで、その後判断はユーザーにまかせる)。

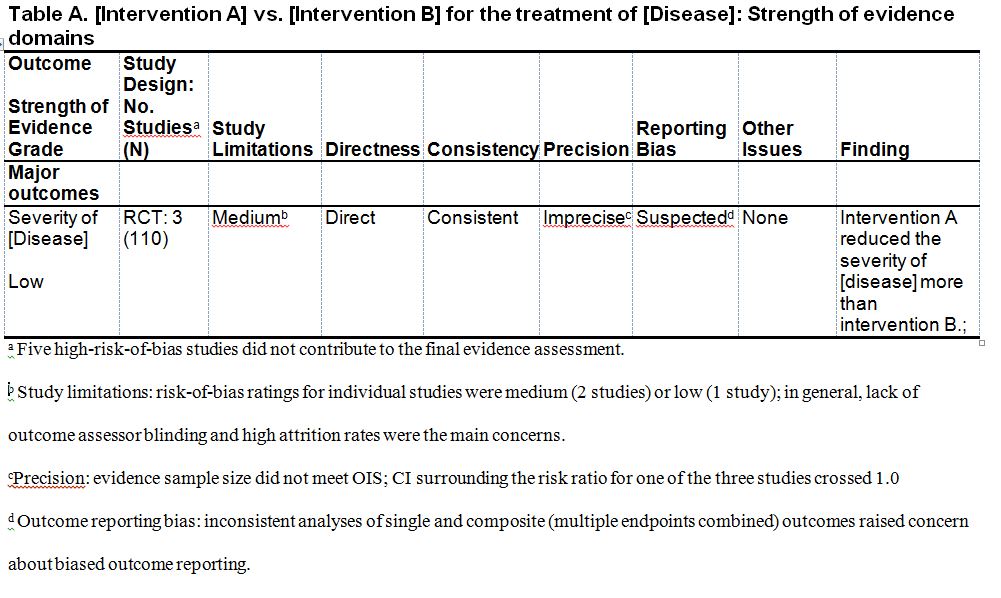
●EPCエビデンステーブル例

evidence table

●注:GRADE working groupは、”Strength of evidence”という用語を、(1)”strength of recommendations”と混同しやすい、(2)効果の大きさと混同しやすい、などの理由から、できるだけ使用しないという方針です。

既存のSRを新規のSRに組み込むための12の提案:EPCガイド

2015年11月10日 Posted by aihara

Agency for Healthcare Research and Quality (AHRQ) Evidence-based Practice Centers (EPCs) は、既存のSRを新規のSRに組み込むための12の提案を発表しました。

Twelve recommendations for integrating existing systematic reviews into new reviews: EPC guidance.
Robinson KA, et al. J Clin Epidemiol. 2015 Aug 7. pii: S0895-4356(15)00369-8. doi: 10.1016/j.jclinepi.2015.05.035.

12

新しい様式のSoF table

2015年11月6日 Posted by aihara

Cochrane method 2015(Cochrane Methods. Cochrane DB Syst Rev 2015 Suppl 1: 1–72)より

Carrasco-Labra1 P, Holger Schunemann et al.
Enhancing the acceptance and implementation of Summary of findings tables in Cochrane Reviews–
New alternative format for summary of findings tables: A randomized controlled trial

[要約]
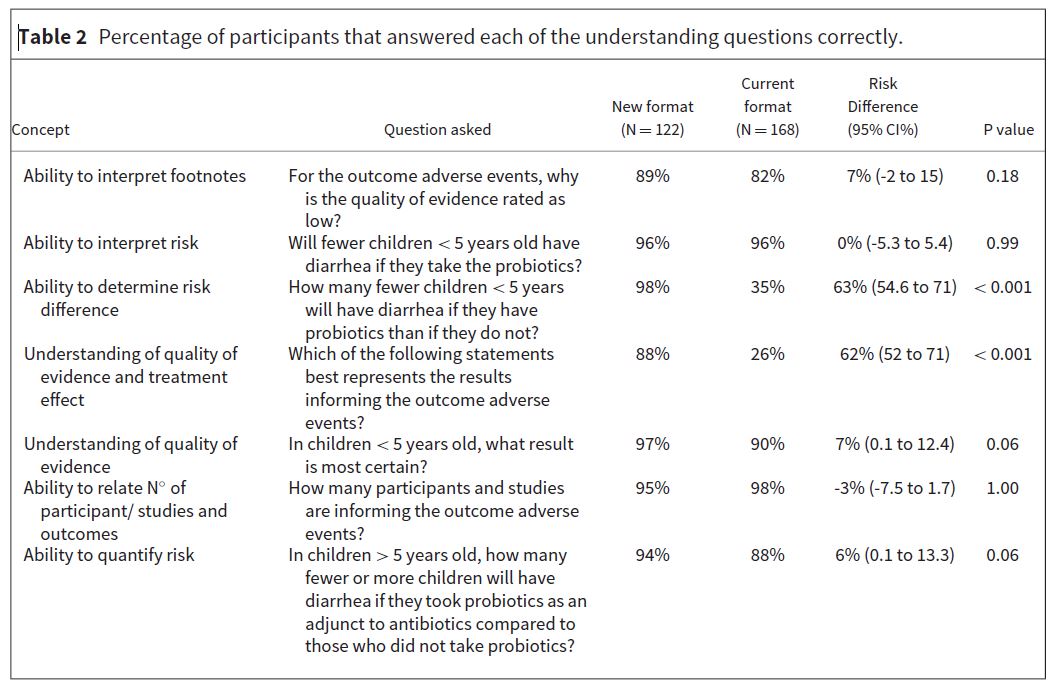
McMaster大学のチームは、2004年からコクランレビューで使われているSoFテーブルについて、新しい様式のSoFの非劣性RCTを実施した。
結果として、(1)リスク差の理解、(2)エビデンスの質と治療効果の理解において、新様式SoFが優れていた。他の5項目については、差がなかった。

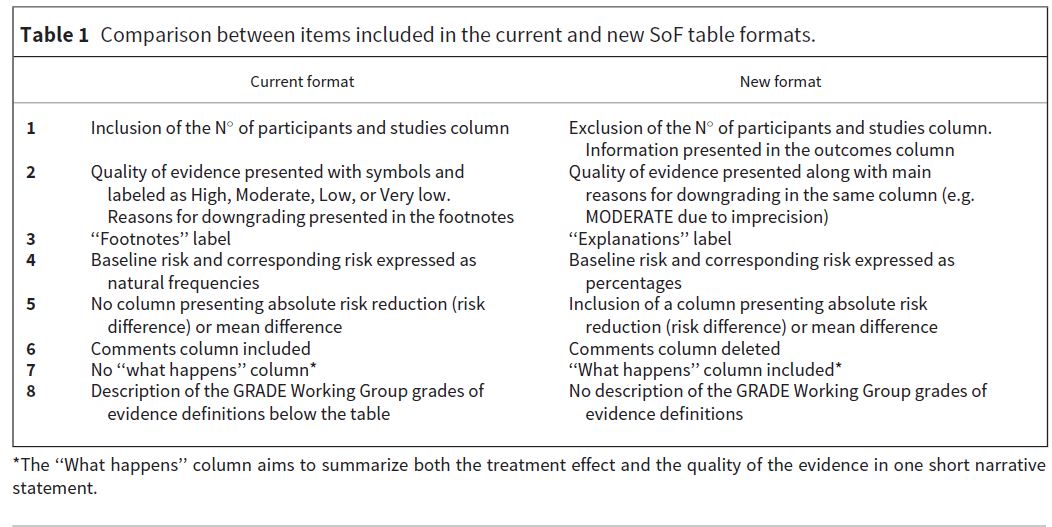
●従来のSoFと新様式のSoF

new_sof-table1

●結果

new_sof-table2

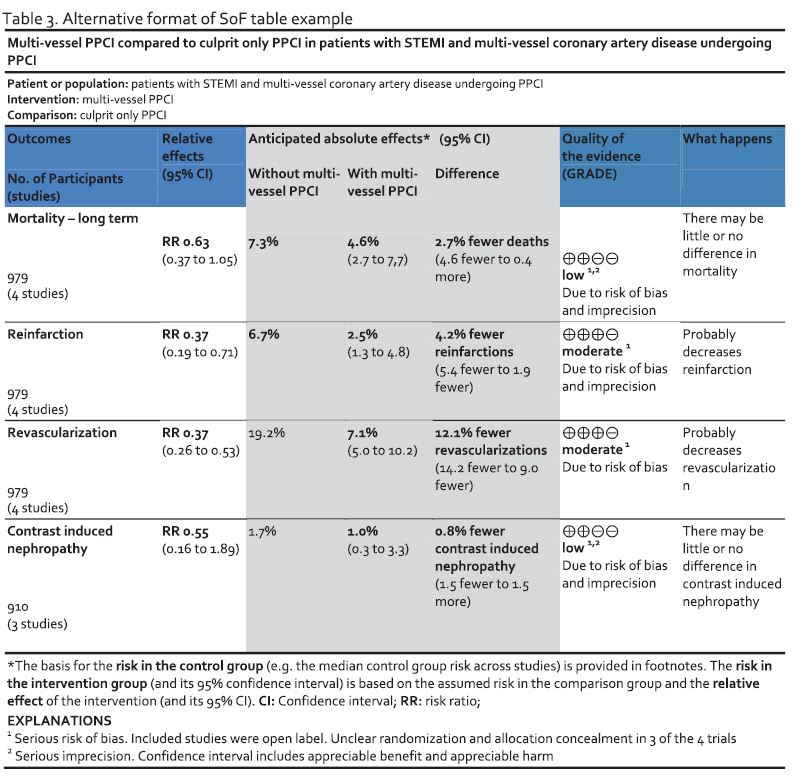
●SoF例

sof_new

●推奨

コクランレビューに、この新様式のSoFを含めることを勧める(strong recommendation, moderate QoE)

Temple Universityの「メタアナリシスとシステマティックレビューのガイド」

2015年10月23日 Posted by aihara

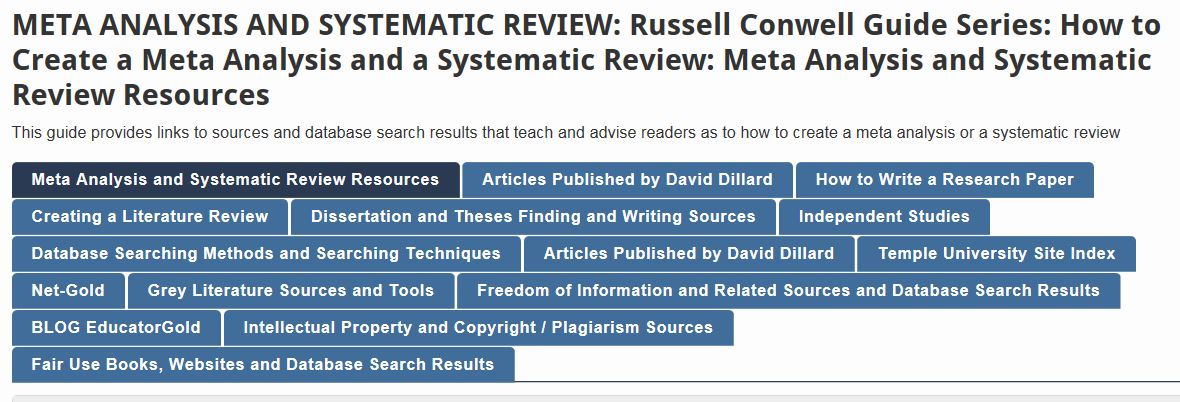
Temple Universityの「メタアナリシスとシステマティックレビューのガイド」(Russell Conwell Guide Series)には、さまざまな資料が紹介されています。

temple univ

●例:Introduction to Systematic Reviews

3. Question/topic refinement
  • Formulate a clearly defined answerable question or series of questions, identifying the Population, Intervention,
    comparison condition, and Outcome(s) of interest
  • Example: “Do psychological treatments for PTSD improve PTSD symptomatology in adults, compared with control conditions (e.g., usual care or waiting list) or alternate psychological treatment?”
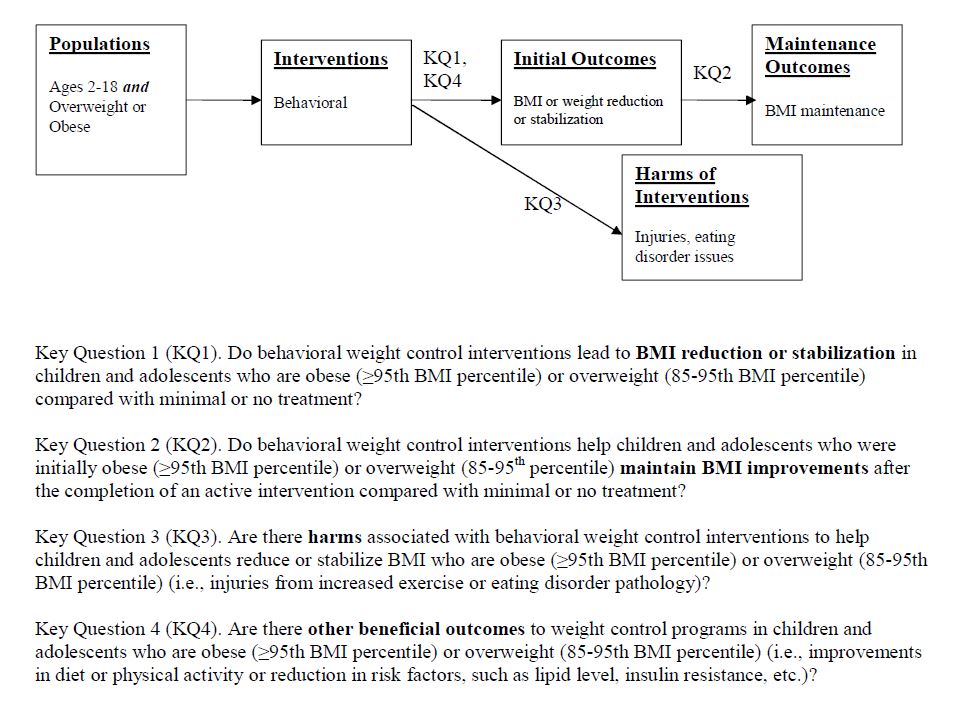
  • If there are multiple, related questions, reviewers often develop an analytic framework, which visually shows the logical pathways underlying your questions. Sometimes reviewers need a higher level diagram and multiple logical pathways that show more detail contained in each high level box. An example of a higher level diagram can be found on page 84 of this report. To see an example of a simple analytic framework with four related questions, click here.
cq_temple

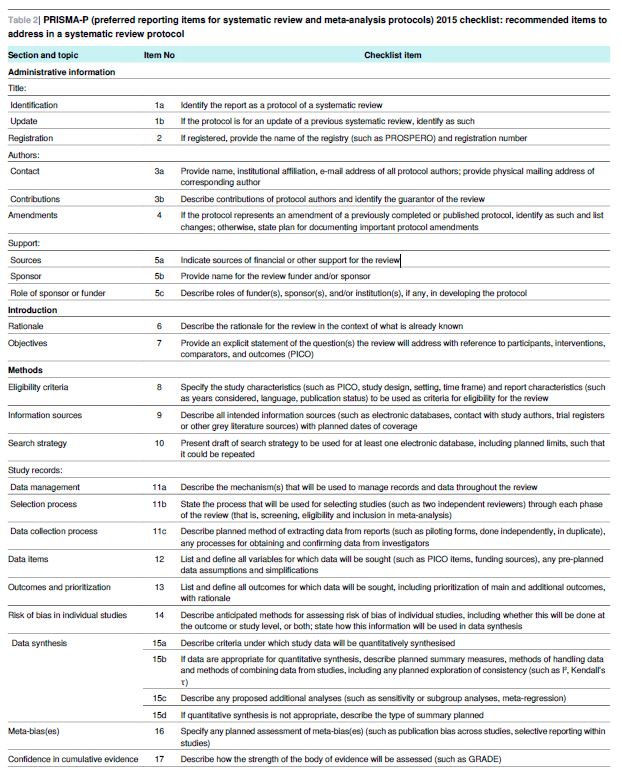
PRISMA-P 2015

2015年10月19日 Posted by aihara

2015年1月に出版されたPRISMA-P 2015を紹介します。PRISMA-P2015は、17項目(26のサブ項目)から成るチェックリストがありますが、そのうち13項目は従来のPRISMAと重複したものです。

Preferred reporting items for systematic review and meta-analysis protocols (PRISMA-P) 2015: elaboration and explanation. Shamseer L, Moher D, Clarke M, et al. BMJ 2015;349:g7647

抄録(Abstract):
システマティック・レビューやメタアナリシスのプロトコルは、レビューの方法の計画と記録を可能にし、レビューの実施に際しての恣意的な意思決定を防ぐ役割を果たし、実施済みのレビューにおける選択的報告の有無を読者が評価することを可能にし、さらに、プロトコルが公開された場合には、重複したレビュー作業を減らし、場合によっては協調を促す効果がある。選択的報告が存在することや、同じまたは類似したトピックに関するレビューの内容に過度の重複がみられることを記録したエビデンスは増え続けており、レビュープロトコルの記録と公開を支持する声が数多く寄せられてきた。近年では、これらの問題を是正するために、実施予定のレビューの国際登録制度(PROSPERO*)の設立や、プロトコルなどのシステマティック・レビューの成果物の掲載を専門とする初のオープンアクセス誌(BioMed Central社の『Systematic Reviews』)の刊行を含むいくつかの取り組みが始められている。ある国際専門家グループは、これらの取り組みをさらに前進させ、PRISMA(Preferred Reporting Items for Systematic Reviews and Meta-analyses (システマティック・レビューおよびメタアナリシスのための優先的報告項目))ガイドラインに基づき、システマティック・レビューとメタアナリシスのプロトコル作成の透明性、正確さ、完全性、頻度を向上させるためのガイドライン、『PRISMA-P 2015』(プロトコル用)を作成した。PRISMA-Pチェックリストには、システマティック・レビューやメタアナリシスのプロトコルにおける必要最小限の構成要素として17の項目が含まれている。
本稿(『PRISMA-P 2015 Explanation and Elaboration』(PRISMA-P 2015の説明と解説))では、各項目の必要性についての十分な理解とエビデンスを提供し、既存の出版済みプロトコルの中から模範となる例を提示する。本稿は、PRISMA-P 2015の記述内容と合わせて読むべきである。システマティック・レビューの著者や評価者に対しては、レビュープロトコルの作成や評価に際しPRISMA-Pを活用することを強く推奨する。

* PROSPERO:prospective register for systematic review protocols.PROSPERO is an international database of prospectively registered systematic reviews in health and social care.

●PRISMA-P 2015 cheklist

prisma_p2015

従来のPRISMA 2009チェックリストと、PRISMA flow diagram

PRISMAチェックリスト2009を使った評価例

(診療ガイドラインのためのGRADEシステム 第2版より)

Cochrane Japanのメンバーによる診療ガイドライン

2015年1月19日 Posted by aihara

Pediatrician advocates use of ‘evidence-based medicine’ in Japan

森先生は、Cochrane Japan支部のディレクターである。
コクランレビューの意義や大切さも熟知している。
SRに準じた診療ガイドライン作成の大切さも十二分に把握している。

コクランレビューのエビデンスの質評価は、GRADEシステムであり、信頼できる診療ガイドライン作成においても、現在はGRADEシステムを採用すべきである。

では、彼が主導して作成した「カンガルケア・ガイドライン」が、いったいどのような手法で作成しているのだろうか・・・「カンガルケア・ガイドライン完全版第2版」において、その一部を知ることができる)(厚労省科学研究班業績集にはより詳細が記載されている)。


●エビデンスの質は、研究デザイン主体の評価である
●CQに対するエビデンス・推奨は、アウトカム主体のbody of evidence評価に基づく推奨ではない
●推奨の強さの基準は、よくわからない (下図)

要するに、コクランの方針とは異なっている。

0119

*****************
しかし、コクランwebサイトで、上記ののように英語で紹介されると、その評価は全く違ったものになる。
多くの読者は、”コクラングループの保証付きの方が、それなりの質のガイドラインを作成している”と思いますよねえ。

上記newsで、森先生は次のように語っている。
“A systematic medicine is necessary in Japan, too, where doctors are getting exhausted because they have had to do everything all alone,”

・・・なので、適切な手法で、適切なガイドランを作成していただきたいのですよ。

  • カレンダー

    2024年3月
     123
    45678910
    11121314151617
    18192021222324
    25262728293031
  • 最近の投稿

  • アーカイブ